Chi-Square Test for Feature Selection in Classification -NBD Lite #14
Simple yet powerful method...
If you are interested in more audio explanations, you can listen to the article in the AI-Generated Podcast by NotebookLM!👇👇👇
Feature selection is one of the most essential preprocessing during the machine learning model process.
We don’t want too many features in our model as it would diminish its performance.
One of the feature selection methods that we can employ is based on the statistical test.
In this article, we will discuss the Chi-Square (χ²) test, which is primarily used for categorical data.
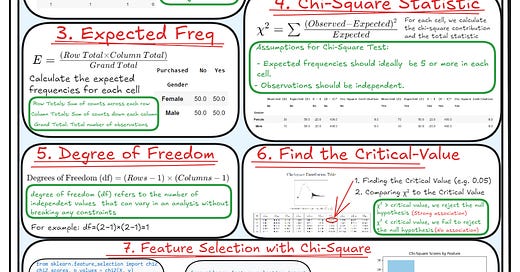
Let’s move on to the central part! For the summary, you can look at the following infographic👇👇👇
Chi-Square (χ²) test for Independence
The Chi-Square test for Independence is a statistical test to evaluate whether two categorical variables have a significant association.
We discuss the Chi-Square test for Independence, as other Chi-square tests are not used for the categorical feature selection.
In the case of the Chi-Square test for Independence, the test has the following hypotheses:
Null Hypothesis (H₀): The two categorical variables are unrelated.
Alternative Hypothesis (H₁): The two categorical variables are not independent (there is an association)
To perform the Chi-Square test for Independence manually to perform feature selection in classification, there are a few steps:
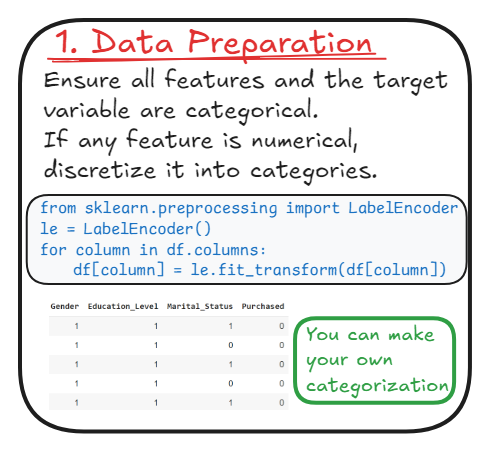
1. Data Preparation
First, we need to ensure the features and the target for our classification are present and in the categorical data type.
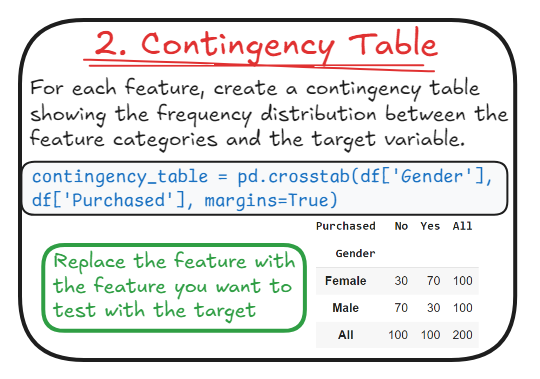
2. Create Contingency Table
Next, create a contingency table that shows the frequency distribution for the categories and the target variables.
Each cell would represent the frequency (count) of occurrences for a specific combination of categories from two variables. In this case, it is the category feature and the target.
We would use the contingency table to calculate the expected frequencies and the Chi-Square statistic.
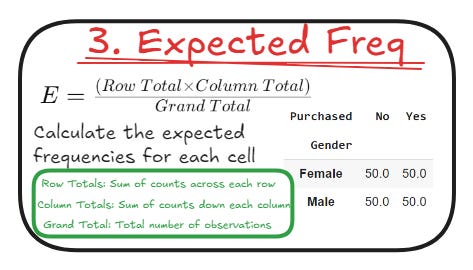
3. Expected Frequencies
Expected frequencies are the theoretical frequencies we would expect in each contingency table cell if there were no association between the two variables—in other words, if the variables were independent.
It’s used as a benchmark comparison against the observed frequencies (actual number) to determine if the differences are statistically significant or just by chance.
The deviation between the expected and observed would also be the basis for calculating the Chi-Square Statistic.
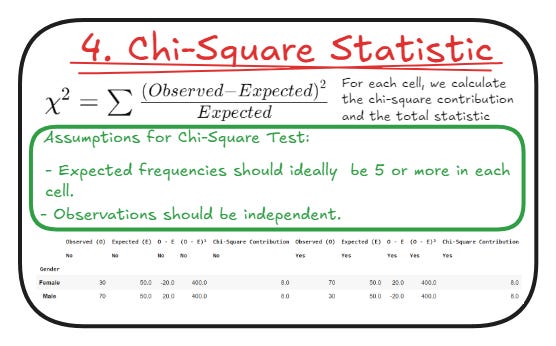
4. Compute the Chi-Square Statistic (χ²)
With the contingency table, the Chi-Square statistic (χ²) is calculated.
It measures the differences between each contingency table cell's observed and expected frequencies.
It quantifies how much the observed data deviates from the expected data, assuming that the two variables are independent.
The Chi-Square statistic (χ²) would then become the basis for comparing against a theoretical distribution for testing the null hypothesis.
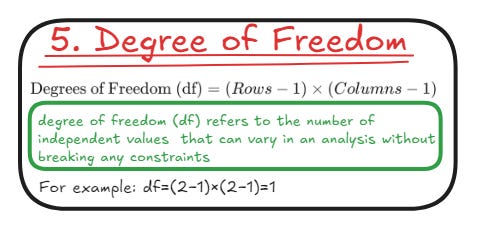
5. Degree of Freedom (df)
Degrees of Freedom (df) is the number of independent values in the final calculation of a statistic that are free to vary.
In a contingency table, they are selected by the number of categories in each variable.
The degrees of freedom would then be used to determine which Chi-Square distribution to use and ensure the validity of the hypothesis result.
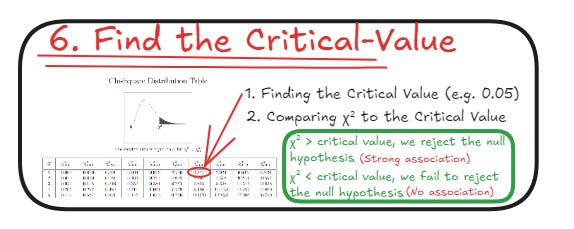
6. Find the Critical Value
The critical value is a Chi-Square distribution threshold corresponding to a chosen significance level (α) and degrees of freedom. For example, we can choose the common one, which is 0.05 (5%) or 0.01 (1%).
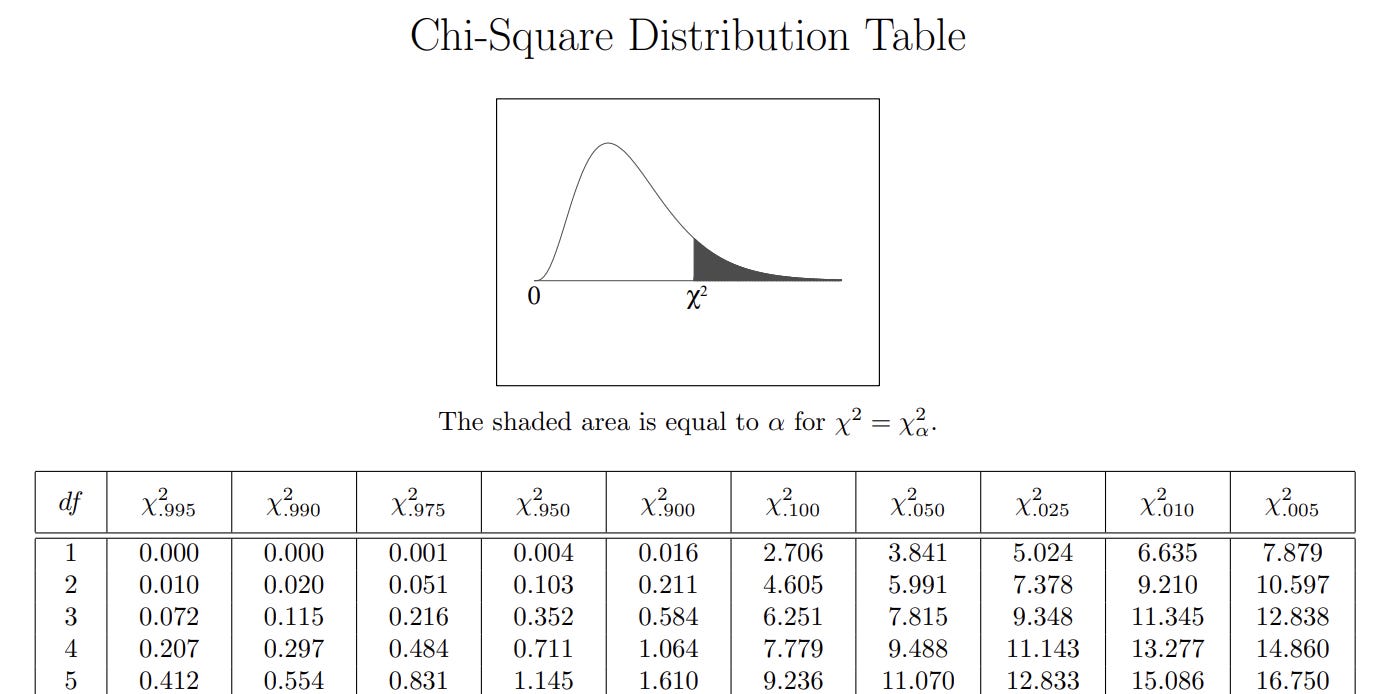
After we selected the significance level, we could find the critical value using the Chi-Square Distribution Table.
Locate the critical value corresponding to the degree of freedom and the significance level.
Then, we compare the critical value to the Chi-Square Statistic we just calculated.
There are two possibilities:
Reject the Null Hypothesis if the Chi-Square statistic (χ²) > Critical Value. This means there are associations between the two categorical variables.
Fail to reject the null hypothesis if Chi-Square statistic (χ²) ≤ Critical Value. This means there are no associations between the two categorical variables.
We then repeat the process for all the present categorical variables and select only the feature that Rejects the Null Hypothesis.
Another way to test the hypothesis is by using the P-value. We usually need additional tools to calculate them, which we will do soon using Python.
The hypothesis is similar to critical value where:
Reject Null Hypothesis if P-value ≤ α (significant level)
Fail to Reject Null Hypothesis if P-value > α (significant level)
7. Code Implementation
We can use Scikit-Learn in Python to perform categorical feature selection with the Chi-Square Test.
For example, this is how you perform feature selection manually with the P-value from the Chi-Square Test.
from sklearn.feature_selection import chi2
chi2_scores, p_values = chi2(X, y)
chi2_results = pd.DataFrame({
    'Feature': X.columns,
    'Chi2_Score': chi2_scores,
    'P_Value': p_values
})
alpha = 0.05
significant_features = chi2_results[chi2_results['P_Value'] < alpha]['Feature']
significant_features
If you want to automatically select the features during the preprocessing and integrate them with the pipeline, we can use the SelectKBest function.
from sklearn.feature_selection import SelectKBest

# Select the top 2 features

selector = SelectKBest(chi2, k=2)
X_new = selector.fit_transform(X, y)
selected_features = X.columns[selector.get_support(indices=True)]
That’s all for today! I hope this helps you understand how to use Chi-Square to perform Categorical feature selection!
Are there any more things you would love to discuss? Let’s talk about it together!
👇👇👇

