Important Information Pandas Series and Data Frame Methods
Some of the most useful method you need to know
Some of the most useful method you need to know

Whether you just learning data science or a professional with years of experience with Python as the main programming language, the Pandas module would be your main weapon. One of the main reasons we use Pandas because this library possesses objects called Series and Data Frame. I would explain my whole article by using the mpg dataset example from the seaborn module.
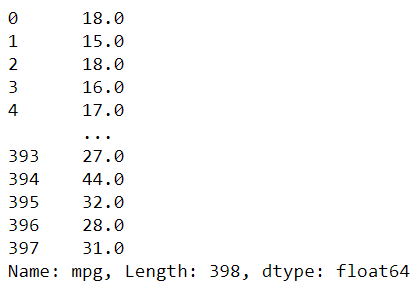
import pandas as pdimport seaborn as snsimport numpy as np#Load the mpg datasetmpg = sns.load_dataset('mpg')This is what Series looks like, a nice one variable/column/feature; depend on what you like to call them.
And this is a Data Frame, a dataset with many series combined into one object.
Just looking at the object, we know that Series and Data Frame are where we would analyze the data. This is what both of these objects are important for Data Scientists. For that reason, I want to introduce some important methods of these objects to gain information that definitely would help you during your Data Science daily work.
What I love about Series and Data Frame methods is how quick I could get the information I need. Here are a few methods I feel important to know.
1. DataFrame.info
.info method is a method specific for the Data Frame object. It would give you all the essential information shown in the picture below.
mpg.info()With just one line, I could get lots of information at once. The information is the total number of the data, how many columns are, the columns name with how many data are not Null and the data type, as well as the memory usage.
2. Series.describe or DataFrame.describe
.describe method are both could be implemented in the Series and Data Frame object. Let’s see what information we could get by using the .describe method.
mpg.describe()From the picture above, we could see that we get all the numerical data basic statistics; which is the Count, Mean, STD (Standard Deviation), Minimum, 25% Quantile, 50% Quantile (Median), 75% Quantile, and Maximum.
How about if we want to get the non-numerical data basic statistic? We could also do that.
#Input exclude parameter as 'number' to exclude all the numerical columnsmpg.describe(exclude = 'number')In this case, we exclude all the numerical columns (Numerical including Boolean column) and end up with the non-numerical columns. As we can see, the information includes Count, Unique (Number of the Unique Value), Top (The most Frequent Value), and Freq (Frequency of the Top value).
The .describe method also exists in the Series object; to be more specific, the .describe method output in the Data Frame object is Series objects collectively combined as one.
mpg['mpg'].describe()This is what we get if we using the .describe method via the Series object, a Series object of the column basic statistic.
3. Series.agg or DataFrame.agg
What if we only need a specific statistic and want to include it in one place. This is where we use the .agg method. This method is used to aggregate many statistics into one Series or Data Frame object. Let’s just try it by an example.
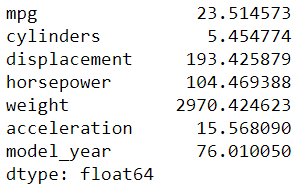
mpg.agg('mean')#we could also use function here, e.g. Numpy#mpg.agg(np.mean).agg method accepting function and/or string as the parameter input. In the picture above, we get a Series object of the mean from all of the numerical columns.
Now, if we want to have more than one type of information, we could actually do that. I show it in the example below.
mpg.agg(['mean', 'std'])Instead of string or function, we input the parameter with a List object which contains all the information we want. This time, we get a Data Frame Object with all the information that we need.
Series also has the .agg method we could use.
mpg['mpg'].agg(['mean', 'std'])The result would be either a number or a Series object of the basic statistic we include in our List object.
4. DataFrame.corr
This method is used to get a matrix of the correlation between numerical columns. You can read my article about Correlation here if you want to know more.
What it takes to be correlated
and how it could be interpreted for our analysistowardsdatascience.com
Let’s try this method by an example.
mpg.corr()By default, the correlation method would calculate the Pearson Correlation between the numerical columns. We could change the parameter to the Spearman Correlation, Kendall Correlation, or callable function we define ourselves.
5. DataFrame.groupby
This method grouping all the numerical columns by the category of the categorical columns. The output is a groupby object. Let’s try it by an example below. For example, I want to group the mpg data by their origin.
mpg_groupby_origin = mpg.groupby('origin')#Groupby object have many method similar to the series or dataframe; for example .meanmpg_groupby_origin.mean()From the code above, we get the mean of all the numerical columns but grouped by the category of the origin. We could also use the .agg method for our groupby object.
# .T is a method to transpose the DataFramempg_groupby_origin.agg(['mean', 'std']).TThe .agg method is similar to the one we use above. We input the parameter either a string/function or List object with string/function as the value.
Conclusion
I have tried to explain some to the Information Method that Series and DataFrame Object from Pandas have. These includes:
.info
.describe
.agg
.corr
.groupby
I hope it helps!


