LLMs Implementation for Tabular Classifications
Trying out ML Tabular Classification Task with LLM
While the world is in awe of the AI and Large Language Model implementation, tabular data still fills up the majority of data science use cases. This is why LLMs are not replacing any usual ML model anytime soon.
Even if LLMs were used for any text activity, there is a possibility to use the model for the tabular data. There are several research that delve into LLM tabular. The implementation is varied, but the research shows promise.
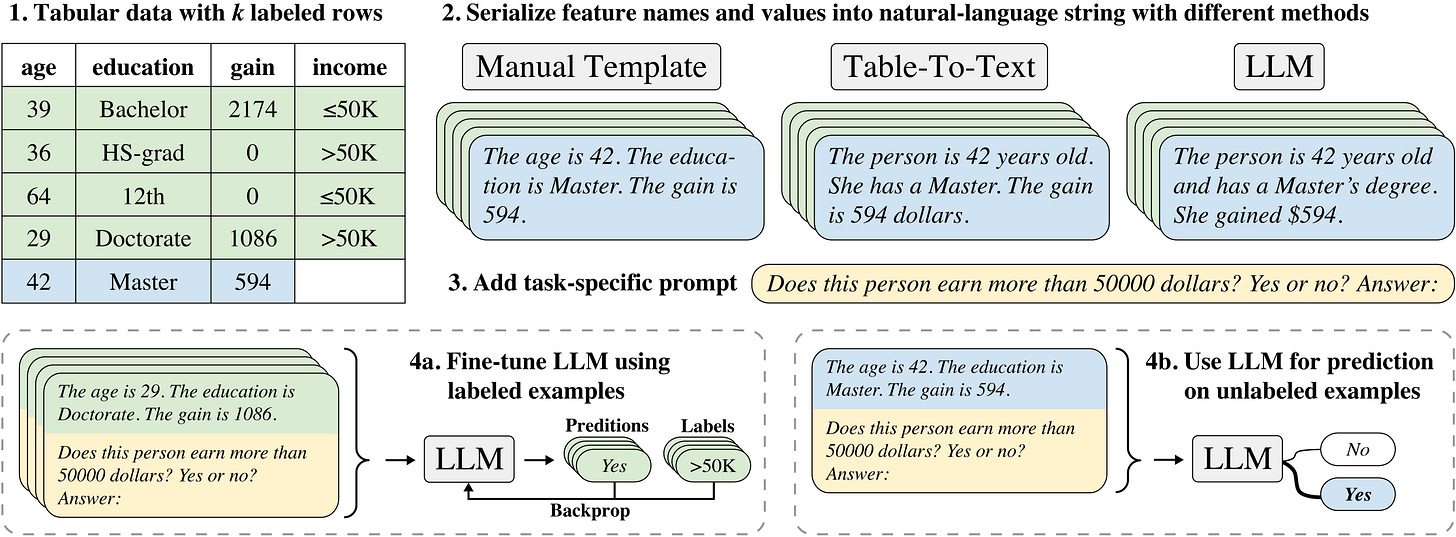
For example, research by Hegselmann et al. (2023) provides a framework called TabLLM that combines LLM and tabular data for a classification model. The framework can be seen in the image below.

The framework above shows that each tabular data point is transformed into a text template that LLM can process. The data would then be processed with a few-shot methodology, either labeled or unlabeled, for further classification.
We would perform experiments on the topic to simulate the tabular data for classification purposes in LLM. How does it work? Let’s explore further.
LLM Classification Experiment
For our experiment, we would use the Telecom Churn dataset from Kaggle. This data contains ten predictor columns with one target (churn or not churn). Overall, the data is shown in the image below.
import pandas as pd

df = pd.read_csv('telecom_churn.csv')The dataset has not yet undergone any data preprocessing but contains no categorical data. For benchmark purposes, we would keep the data as it is and use a simple model to see the overall performance.
Let’s use the Logistic Regression model from Scikit-Learn as the classification benchmark.
from sklearn.model_selection import train_test_split
from sklearn.linear_model import LogisticRegression

X_train, X_test, y_train, y_test = train_test_split(df.drop('Churn', axis =1), df['Churn'], test_size=.2, random_state = 42)

model = LogisticRegression()

# Train the model
model.fit(X_train, y_train)

# Make predictions
y_pred = model.predict(X_test)
We would use the F1 Score to evaluate the model.
from sklearn.metrics import f1_score
print('F1 Score: ', f1_score(y_test, y_pred)) As we can see in the image above, the F1 Score is relatively low. The benchmark model does not classify the churn event from given data.
Let’s try out LLM for the classification model. First, we must transform our tabular data into acceptable forms for LLM. We would use the following code for the data transformation in this case.
def concatenate_text(x):
    if x['ContractRenewal'] == 1:
      cr = 'have renew the contract'
    else:
      cr = 'never renew the contract'

    if x['DataPlan'] == 1:
      dp = 'have data plan'
    else:
      dp = "doesn't have data plan"

    full_text = (
        f"This customer account is {x['AccountWeeks']} weeks old, ",
        f"{cr}, ",
        f"{dp}, ",
        f"with {x['DataUsage']} GB of Monthly Data Usage, ",
        f"{x['CustServCalls']} times of Customer Service Calls, " ,
        f"{x['DayMins']} minutes total usage average monthly, ",
        f"{x['DayCalls']} times in average of daytime calls, "
        f"{x['MonthlyCharge']} monthly bill average, "
        f"with the largest overage Fee in the last 12 month is {x['OverageFee']}, "
        f"and {x['RoamMins']} minutes in average for roaming"

    )
    return ''.join(full_text)

X_train['label'] = y_train
X_test['label'] = y_test

X_train['text'] = X_train.apply(lambda x: concatenate_text(x), axis=1)
X_test['text'] = X_test.apply(lambda x: concatenate_text(x), axis=1)Let’s see the example data that we have transformed into text form.
X_train['text'].iloc[0]In the text above, we try to give all the information from our tabular data into sentences that the LLM could accept. In the next part, we will fine-tune an LLM model for text classification.
I would use the BERT base model as the foundation model for the classification. We can use the following code to fine-tune our model with our data.
import torch
from transformers import BertTokenizer, BertForSequenceClassification, Trainer, TrainingArguments
from datasets import Dataset
import numpy as np
import evaluate

# Define label mappings
id2label = {0: "NOT-CHURN", 1: "CHURN"}
label2id = {"NOT-CHURN": 0, "CHURN": 1}

# Convert to Hugging Face Dataset format
train_dataset = Dataset.from_pandas(X_train)
test_dataset = Dataset.from_pandas(X_test)

# Tokenization
tokenizer = BertTokenizer.from_pretrained('bert-base-uncased')

def tokenize_function(examples):
    # Adjust based on the structure of your dataset
    return tokenizer(examples['text'], padding='max_length', truncation=True, max_length=128)

tokenized_train_dataset = train_dataset.map(tokenize_function, batched=True)
tokenized_test_dataset = test_dataset.map(tokenize_function, batched=True)

# Format the datasets correctly with labels
tokenized_train_dataset = tokenized_train_dataset.map(lambda x: {'labels': x['label']})
tokenized_test_dataset = tokenized_test_dataset.map(lambda x: {'labels': x['label']})

# Define the model with label mappings
model = BertForSequenceClassification.from_pretrained(
    'bert-base-uncased',
    num_labels=len(label2id),
    id2label=id2label,
    label2id=label2id
)

# Define training arguments
training_args = TrainingArguments(
    output_dir='./results',
    num_train_epochs=5,
    per_device_train_batch_size=8,
    per_device_eval_batch_size=8,
    warmup_steps=500,
    weight_decay=0.01,
    logging_dir='./logs',
    logging_steps=10,
    evaluation_strategy="epoch"
)

# Evaluation metric
f1 = evaluate.load("f1")

def compute_metrics(eval_pred):
    logits, labels = eval_pred
    predictions = np.argmax(logits, axis=1)
    return f1.compute(predictions=predictions, references=labels)

# Define the trainer
trainer = Trainer(
    model=model,
    args=training_args,
    train_dataset=tokenized_train_dataset,
    eval_dataset=tokenized_test_dataset,
    compute_metrics=compute_metrics
)

# Train the model
trainer.train()
You can tweak the parameter, but I want to see overall performance with the above parameter. The F1 results from our training are shown in the image below.
# Evaluate the model
results = trainer.evaluate()
print(results)The F1 Score is twice the Logistic Regression benchmark model, which shows a promising start.
We can also examine the prediction result to understand why the model provides the output result with LIME.
from lime.lime_text import LimeTextExplainer
import torch

# Ensure the model is in evaluation mode and moved to CPU
model.eval()
model.to('cpu')

# Define a prediction function that only uses the CPU
def predictor(texts):
    inputs = tokenizer(texts, return_tensors="pt", padding=True, truncation=True, max_length=128)
    with torch.no_grad():
        logits = model(**inputs).logits
    return torch.softmax(logits, dim=1).numpy()  # No need to move to CPU as it's already there

# Create a LIME explainer
explainer = LimeTextExplainer(class_names=["NOT-CHURN", "CHURN"])

# Choose a specific instance to explain
idx = 0  # Index of the sample in your dataset
text_instance = X_test.iloc[idx]['text']

# Generate explanation
exp = explainer.explain_instance(text_instance, predictor)
exp.show_in_notebook(text=True)The prediction shows that the have word might influence the model to produce a Not-Churn prediction.
We might want to improve our model by choosing another foundation model or playing around with the parameter. However, the experiment has shown that LLM could be used for tabular data classification purposes.
Thank you, everyone, for subscribing to my newsletter. If you have something you want me to write or discuss, please comment or directly message me through my social media!


