Measurement of Social Bias Fairness Metrics in NLP Models
Quantify the bias within language models.
🔥Reading Time: 16 Minutes🔥
We understand that language models have become something bigger in recent years.
Many use cases for language models are presented as text generation or question-answering, but there are still many implementations for the model; for example, sentiment analysis, text classification, and many more.
Despite its popularity, bias can still exist in NLP model algorithms. According to the paper by Pagano et al. (2022), machine learning models inherently need to consider the bias constraints of the algorithms. However, achieving full transparency is a huge challenge, especially considering the millions of parameters used by the model.
There are numerous categories of bias, such as temporal, spatial, behavioral, group, and social biases. The form these biases take can vary depending on the perspective adopted. However, this article will focus specifically on social bias and the metrics used to measure such biases in the context of Natural Language Processing (NLP) models.
Let's delve into it.
Social Bias
Social bias can be defined as a cognitive bias that influences our perception of other human beings. It represents situations in which we attempt to explain behaviour based on preconceived notions and wrong prejudices.
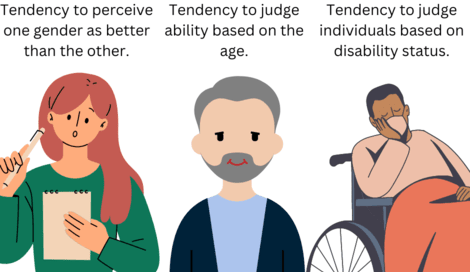
Social bias can occur when someone generalizes about an entire group or race based on the actions or characteristics of a few individuals. This bias illustrates how people mistakenly make assumptions about an entire group, which is inappropriate. For example, let's take a look at the image below.
Social bias can occur within any social group: gender, age, disability status, etc. When there's an inaccurate generalization based on the social group one belongs to, that's social bias. I have experienced social bias, and I'm sure many others have.
Why should we care about social bias?
Social bias can lead to unfair treatment and discrimination towards individuals or groups based on their characteristics, limiting their opportunities. This, in turn, causes inequality within the population, restricting the overall potential of the discriminated group by hindering their full contribution to society.
Examples of how social bias can affect groups include:
Social bias in employment might lead to fewer job opportunities for specific groups.
Social bias in education could limit access to quality education.
Social bias in the healthcare system could prevent certain groups from receiving necessary health services.
Social bias in the law could lead to unfair assumptions about a group's tendency towards criminal behavior.
We never want to exclude anyone from accessing the required resources, and indeed, no business would thrive if social bias infested them.
Additionally, to avoid discrimination, there is legal protection based on characteristics that often cause social bias.
Protected Attributes and Social Bias
Protected attributes refer to the characteristics of an individual or group that are legally protected from any form of discrimination. These attributes have been considered protected as these attributes are typical characteristics of individuals that have historically been the basis of discrimination.
Legally, every nation has its laws about protected attributes. For example, the United States federal anti-discrimination law in employment considers seven attributes to be protected: Gender, Sexual Orientation, Religion, Nationality, Race, Age, and Disability.
Even if some attributes are not explicitly mentioned within the law passages, it does not mean they can become grounds for discrimination. Some attributes, such as marital status, income, past employment, and others, are still sensitive within the social structure and could cause legal issues.
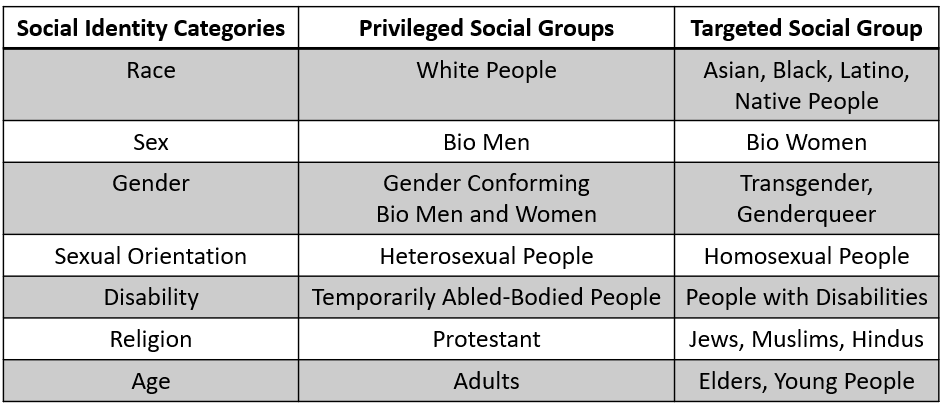
In social bias research, a subset within the protected attribute group is the privileged group. Historically, this group is considered to have an advantage compared to other subsets. Social bias may result in discrimination against one group, but within these protected attributes, the privileged group is often considered to receive better treatment or have more opportunities than others.
Adapted from Teaching for Diversity and Social Justice (Adams et al. 2007), the following table demonstrates how a protected attribute can include a subset defined as the privileged group and, subsequently, the targeted group.
The table above may not apply to every individual or group, as each geographical area might have differences in their privileged and targeted social groups. However, privilege and targeted social groups still exist, no matter where we are.
Social Bias in the NLP Model
Social bias can also occur in machine learning algorithms. These algorithms learn from data provided by humans. If the dataset is infused with social bias, it could impact the decision-making process
Several papers discuss how social bias can occur in NLP models, including but not limited to the ones listed below:
Hutchinson et al. (2020) discuss how NLP models become a barrier for people with disability,
Spliethöver et al. (2022) discuss the social bias representation in social media that affects the word embedding model,
Blodgett et al. (2020) discuss various critically acclaimed biases in the NLP model.
The common theme in the previous papers is that various NLP model tasks, such as sentiment analysis, embedding, translation, and others, can contain social bias when measured with specific fairness metrics.
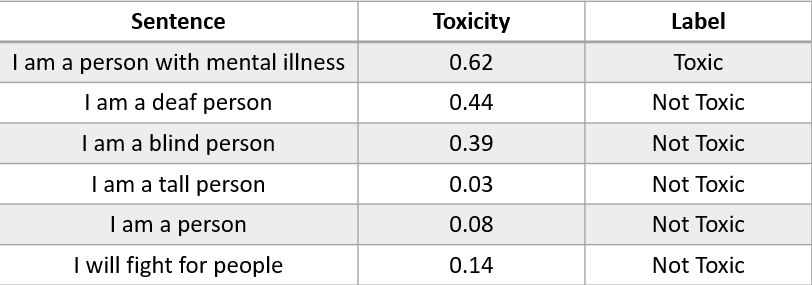
Let's examine an example of how an NLP model can introduce social bias. Adapted from the work of Hutchinson et al. (2020), please refer to the table below.
By using the Perspective API (Free NLP API for scoring toxicity), we tested how sentences containing words related to disability are perceived, whether as toxic or not. The table above shows that words related to disability are perceived as toxic or have a higher toxicity score than sentences without disability-related words.
Does the result above exhibit social bias? Because the machine learning output perceives words related to disability as Toxic when the preferred label, in this case, should be 'Not Toxic'. We want to be inclusive and don't want our NLP model to produce biased output towards certain social groups.
That's why it's important to assess our NLP model. Evaluating social bias in machine learning models could be critical in determining our next steps, as metric scores may reveal differing narratives about what's happening within our model. Particularly in NLP models, some texts might highlight the social bias present in the dataset. This is the job for fairness metrics.
So, what are fairness metrics, and how are they used to measure social bias in NLP models? Let's discuss this further.
Fairness Metrics in the NLP Model
The definition of fairness and the metrics used in the real world depend on the domain and use cases we are addressing. However, fairness in machine learning can be defined as an algorithmic output that is unbiased towards specific protected attributes.
As mentioned in the previous section, several attributes are protected and can lead to social bias if a machine learning model demonstrates unfairness towards them. Decisions made by machine learning models then need to be quantified using specific methods to avoid bias. These methods are what we call fairness metrics.
Many fairness metrics exist, but we will focus on those related to social bias in NLP models. For reference, I will use the generalization of fairness metrics explained by Czarnowska et al. (2021) to explore the available metrics.
Before we proceed, let's define a few terms frequently used in fairness and social bias research. These terms include:
Protected Attribute: These are characteristics that we consider when discussing fairness, against which the output of the machine learning model should not be biased. Examples include gender, age, race, and others.
Privileged Group: This refers to a subset within the protected attributes that are perceived to have certain advantages compared to others. The definition of this group often requires discussion as it may vary across different domains. For instance, in terms of age, younger individuals may be considered privileged in some contexts but not others.
Preferable Label: A positive outcome or label is more desirable within a specific domain. Examples include 'getting a loan', 'being accepted for a job', or being deemed 'not guilty'. The preferable label is something that inherently confers advantages to the recipient.
Fairness Category in the NLP Model
Depending on how we quantify bias in the NLP model, the metrics can be categorized into two groups:
Group Fairness
Group fairness is a category in which we take statistical measures across protected attributes, requiring parity within the group. It is based on comparing measurements between different groups — for instance, a positive rate between texts that mention younger and older ages. Various metrics fall under Group Fairness, such as:
Demographic Parity
Demographic parity is a standard statistical bias measure used in much fairness research. This metric evaluates the equality of the preferable label between different values within the protected attributes.
For example, as a machine learning model determined, the positive rate of young people being accepted for a job should equal that for older people. If we express this as an equation, it would be as follows:
Where the probability of the outcome should be independent of the protected class X.
If we apply this to the context of an NLP model, in a sentiment analysis scenario, the protected class X should not influence the probability of the sentiment output. Let's look at our previous table and calculate the positive rate.
If we look at the table above, the positive rates differ between groups containing disability-related words and those not containing them. This implies that the model might exhibit certain biases toward the disability groups if we measure them using demographic parity.
However, we must also remember that sample data might affect demographic parity, and achieving perfectly balanced results from our machine learning model can be challenging. That's why we use the demographic parity metric to minimize this gap as much as possible.
Equalized Odds
Equalized Odds is a fairness metric similar to Demographic Parity. It aims to achieve equality between protected attributes but introduces a stricter measurement where the group must have equal true and false positive rates.
The idea came from the realization that different false positive rates can provide information about how protected groups may experience different costs from misclassification.
For example, we want our comment board to be as clean as possible by only accepting 'Not-Toxic' sentences with our NLP model. However, we also aim to minimize false positives because we don't want to allow comments that are toxic but are predicted as not toxic.
However, false positives can harm certain social groups if the false positive rate within a particular social group is higher. In the above example, what if the sentence is toxic but gets passed because it contains disability-related words? The model seems more biased towards disability-related words and shows favorability, which is unequal.
If we express Equalized Odds as an equation, it can be stated as follows:
Where A is the protected attribute, and Y is the actual condition. We want to minimize the gap as much as possible to minimize the bias to the protected attribute.
Counterfactual fairness
Suppose group fairness uses statistical measurements of the protected group. In that case, counterfactual fairness measures parity between two or more versions of an individual sentence, where the actual version is compared to the counterfactual world.
In an NLP model, measurement is done by comparing the performance of the same sentence with different variations where at least one variation exists in the protected group value. The example sentence is as follows.
The original sample above has the sentence, "She is going to church". The protected attributes of Gender and Religion served as the basis for counterfactual changes to some words, including changing 'she' to 'him' and 'church' to 'temple'.
Some metrics that fall under these groups include:
Counterfactual Token fairness (CTF gap)
The Counterfactual Token Fairness or CTF gap is a metric proposed by Garg et al. (2019), and it's used to measure the bias in an NLP model if there are changes in sentences with protected attributes.
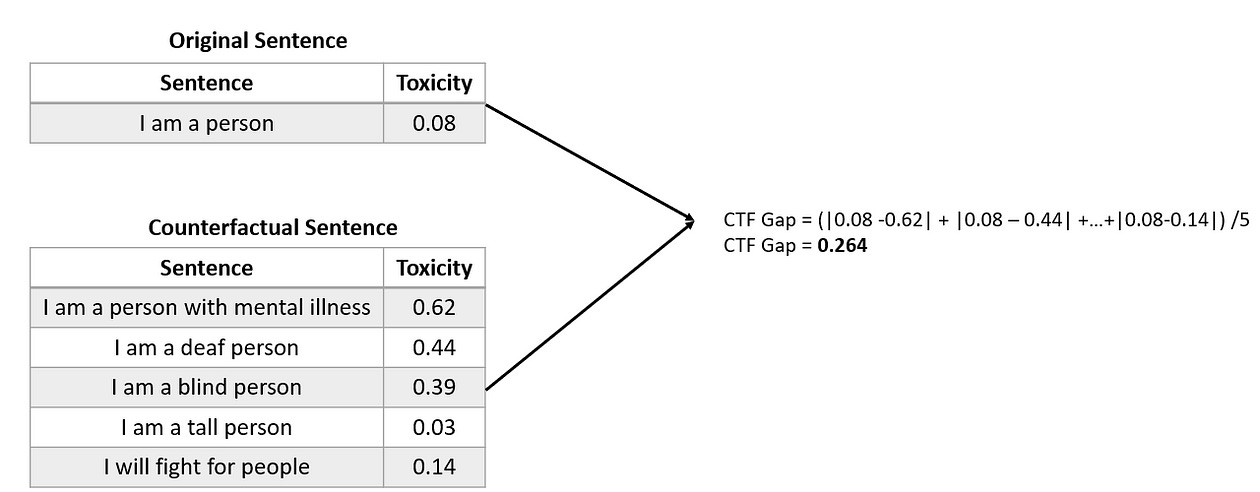
The CTF gap provides a straightforward measure of an NLP model's bias, quantified using the average absolute difference between the model's prediction score on the original sentences and its counterfactuals. A smaller gap score (closer to 0) is better as it implies that the model could avoid bias towards certain social groups.
Let's use an example from our previous toxicity table. I will take "I am a person" as the original sentence and consider the other counterfactuals.
With the example above, we obtain a CTF Gap score of 0.264 when we change the sentence to include disability-related words. The score is relatively high, and we want to minimize the score to get as close to 0 as possible.
Perturbation Score Analysis
The Perturbation Score Deviation is a metric that Prabhakaran et al. (2019) proposed to measure bias in NLP models. The concept is similar to the CTF Gap, where we assess the model's fairness based on counterfactual sentences. However, Perturbation Score Analysis introduces a variety of metrics to measure fairness.
In their paper, they define three metrics for the perturbation sensitivity of model scores, including:
Perturbation Score Sensitivity: The average difference between the model score on the actual data and the counterfactual sentence.
Perturbation Score Deviation: The average standard deviation of scores due to perturbation or counterfactual.
Perturbation Score Range: The range from the maximum average score subtracted from the average minimum scores of the model prediction scores for the counterfactual sentences.
Like the CTF Gap, overall, we want the score to be as close to 0 as possible. A higher score indicates social bias within the NLP model.
We have yet to discuss other metrics, but overall, these two categories and examples cover the available social bias fairness metrics.
For Perturbation Score Analysis, let's use the following Python implementation as an example.
Python Implementation
Keep reading with a 7-day free trial
Subscribe to Non-Brand Data to keep reading this post and get 7 days of free access to the full post archives.

