The tale of the extreme data

What is Outlier? According to Wikipedia, Outlier is a data point in the dataset that differs significantly from the other data or observations. Just look at the picture above, there are a series of bottles, but one is colored differently. This one bottle is what we called an outlier.
The outlier is inherently different than Noise. While Outlier is a data that significantly different compared to the other data, Noise is a random error or variance. The outlier is part of the data, but Noise is just a random error (could be mislabeled or mistake or even missing data).
Many parametric statistics, like mean, correlations, and every statistic based on these is sensitive to outliers. Since the assumptions of standard statistical procedures or models, such as linear regression and ANOVA also based on the parametric statistic, outliers can mess up your analysis.
So, what about the outlier in the dataset? How we classified it? How could we detect it? Why is it essential? And what to do with the outlier? Let’s get into it.
Outlier Classification
Generally, Outlier could be classified into two kinds:
Univariate Outlier. This is an outlier that presents in a single variable or, in other words, an outlier in a single column. Let’s see it in an example below.
In the salary column above, there is exist one outlier (5000). This outlier only presents in the salary column, and that is why this outlier is classified as Univariate Outlier.
Multivariate Outlier. This is an outlier that occurs within the joint combination of two (bivariate) or more (multivariate) variables, which in contrast with the Univariate outlier.
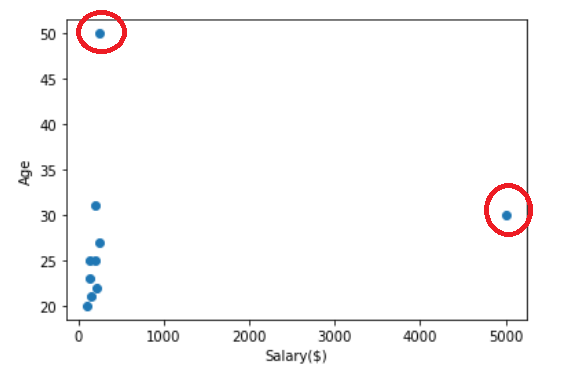
For example, the graph above is a scatter plot between salary and age variables. In this plot, there are presents two bivariate outliers from the association of both variables. In a single variable, the data might not be an outlier, but when it is associated with another variable, the outlier might occur. This is what we called multivariate outliers.
Multivariate outliers are only present in an n-dimensional space (of n-features) where n is more than one. When the n number is more than three, we might have a hard time imagining or visualize it. That is why we need to train a model to do it for us.
Depending on the environment, Outlier could also be classified into three different kinds:
Global Outlier (Point Outlier). This is an individual data point that considered to be an outlier with concern to the rest of the data. The outlier in the multivariate outlier figure above could be regarded as a Global Outlier.
Contextual Outlier. This outlier is different than the other outlier because we need domain knowledge or contextual understanding. We could define a contextual outlier as a data point that different significantly based on the selected context. For example, do you think 12C degree temperature in Toronto, Canada, would be considered as an outlier? It depends on the season (winter or summer). It might not be in the summer, but it would be in the winter.
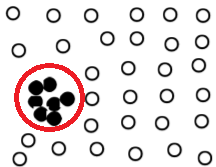
Collective Outlier. It is an outlier where a collection of data (subset) with respect to the whole dataset is significantly different, although individual data might not be an outlier. Let’s see an example below.
The data individually might be not an outlier, but as a collective, it becomes an outlier. This is what we called Collective Outlier.
Detecting Outlier
In general, there is no single way that says this technique is the best to detect an outlier. What is important is our understanding of why we want to find the outlier. Therefore, the context of detecting outliers is more important than the technique itself. Also, you must have a clear separation context between Noise and Outlier as sometimes people mixed things up.
Another question we must ask, is it Univariate/Multivariate Outlier? And is the variable distribution would fulfil the Parametric/Non-Parametric condition?
In this article, I would only show some methods that often used without deeper understanding as my purpose in this article is to state why outlier is important.
Some important techniques including:
Z-score using the empirical rule
There are still many more techniques, but just like I stated before. There is no single technique that is the best technique for detecting outliers. We must analyze the result rather than rely on the technique itself.
Outlier Importance
We already know that outlier is an extreme data or data that differ significantly from the other, but why is it important?
One reason is just as I explained above; many statistic procedures are affected by the presence of outliers. With the outlier present, the statistical power of these methods would have less power; hence, unreliable results. Would it better to remove the outlier then? If you only and only care about statistical results, then removing the outlier could be an option, but we still need to ask a few questions before we are dropping it.
Is the outlier because of error measurement or incorrectly entered? — Then it is a Noise and should be dropped (or change, if you know the real value of the data)
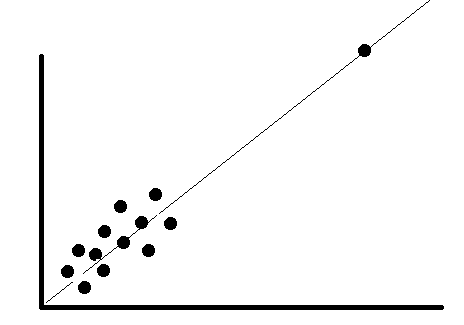
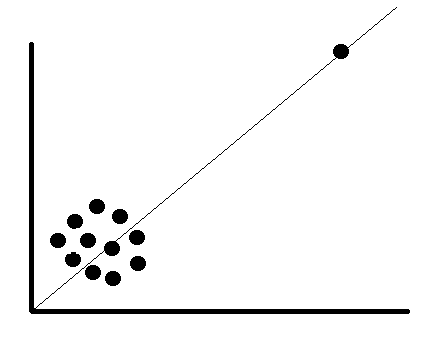
Is the outlier does not change the results but does it affect the assumptions? In this case, you may drop the outlier or not. Just see the example below, with outlier absent or not, the regression line would still stay the same.
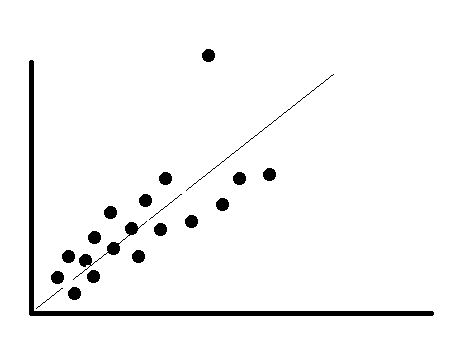
Is the outlier affects both statistical results and the assumptions? In this case, we cannot merely drop the outlier. Try to run the analysis with or without the outlier and see how the result is. Let’s see in the example below; if we remove the outlier, the regression line will move. This outlier certainly part of the data and need a legitimate result to drop it.
Is the outlier create a significant association? If so, it is advisable to drop the outlier. Let’s see an example below; there is certainly no relationship between the data point. With an outlier present, the association is created. This is means the regression coefficient does not truly describe the relationship between two variables.
Clearly, from a statistical standpoint, there is some suggestion for removing the outlier or not. If not, there is an option for transforming the data to pull in the high numbers or just use a different model.
The problem with these “outlier solutions” is that they also cause problems — biased parameter estimates and underweighted or valid values elimination.
What we need to remember; not all outliers are the same. Some have a strong influence, some not at all. Some are valid and important data values. Some are simply errors or Noise.
So, I would not give any recommendation, but instead, take some time to figure out a few things:
Why do you want to find the outlier? You might be want to see the outlier because you are interested in the abnormality. Think about what your question is.
Is the outlier “actually” causing any problems with the result, influence, or assumptions?
Where did the outlier come? This might take in-depth analysis and domain expertise. Moreover, You can’t always tell where it is come from, but try to consider different possibilities because it can help inform the best way to proceed.
Conclusion
Whichever approach you take, you need to know your data and do your research very well. You might also try different methods and see which makes theoretical sense and suitable to answer your question. My advice is just to take your time in doing the outlier research.


